![Nav Support Center.svg]](https://help.foodnotify.com/hubfs/Support%20Center/Design/Nav%20Support%20Center.svg)
Under Insights you find the F&B Cost Analysis. It compares two values:
- Theoretical cost – what your sales should cost according to your recipes.
- Actual cost – what you actually used according to Inventory.
The difference shows you where money is lost – or where your data still has gaps. For accurate results you need a connected POS system, recipes for your POS items and complete bookings in Inventory. Here is how: How do I get accurate numbers in FoodNotify?
Open and filter Insights
Click Insights in the sidebar. At the top you choose:
- Period – the date range you want to analyse.
- Location – one or more locations.
- View – Ingredients (Actual vs. Theoretical), Runner vs. Bummer or Food Waste.
On the right above the key figures you see when the data was last synced, for example “Data synced 10 minutes ago”.
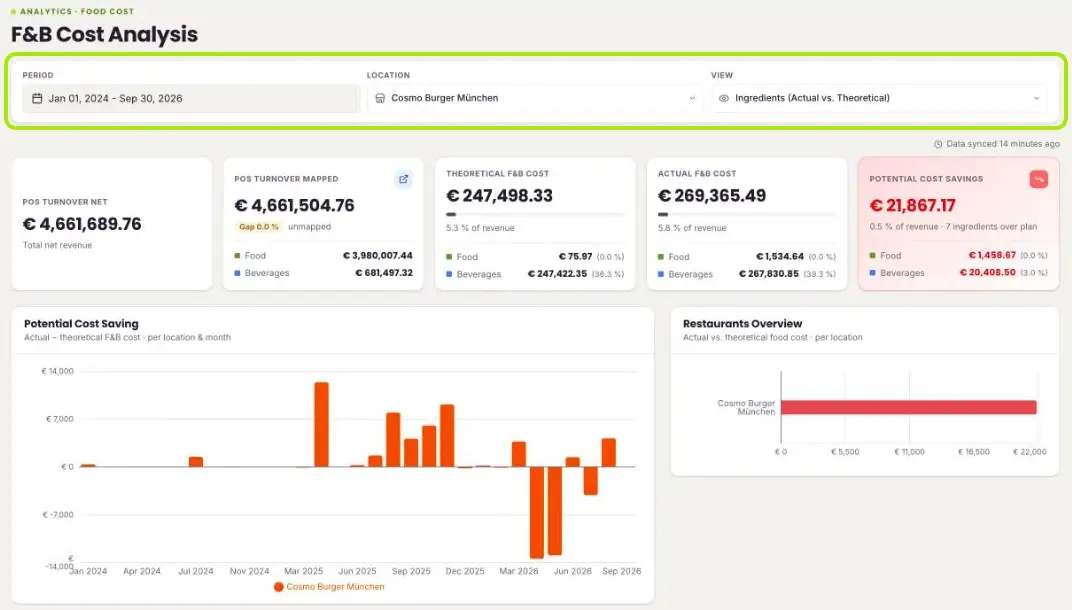
The key figures
- POS Turnover Net – your total net revenue from the POS system in the selected period.
- POS Turnover Mapped – the revenue whose POS items are connected to a recipe. Gap … % unmapped shows the share that is still missing.
- Theoretical F&B Cost – what the food and beverages you sold cost according to your recipes, with the share of revenue.
- Actual F&B Cost – your actual cost of goods according to Inventory, also with the share of revenue.
- Potential Cost Savings – actual minus theoretical. If the amount is positive, the tile is red: you used more than your recipes allow for. Below it you see how many ingredients are over plan.
Except for POS Turnover Net, all tiles also split the values into Food and Beverages.
The charts
- Potential Cost Saving – actual minus theoretical F&B cost per location and month. Bars above zero show months with overuse, bars below zero months in which less was used than the recipes allow for.
- Restaurants Overview – compares actual and theoretical food cost per location, so you see which location deviates most.
Ingredients: actual vs. theoretical
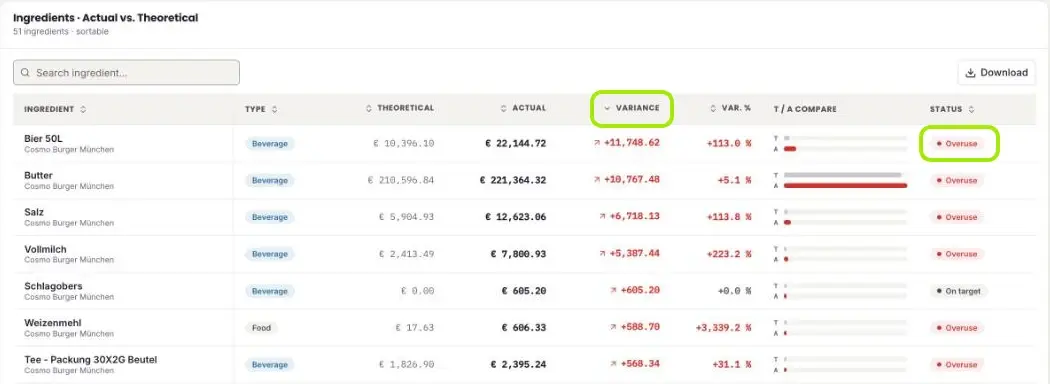
In the Ingredients (Actual vs. Theoretical) view, the table below the charts lists every ingredient with its Type (food or beverage), the theoretical value, the actual value, the Variance as an amount and in percent, the T / A Compare bars and the Status:
- Overuse – more used than the recipes allow for.
- On target – actual and theory match.
- Saving – less used than the recipes allow for.
Click a column header to sort – for example Variance, so the biggest outliers are at the top. Use Search ingredient… to find single ingredients and Download to export the table.
Daily stock movements of an ingredient
Click an ingredient. A window shows how its stock developed day by day – with Opening, Import (for example imported orders), Transfer, Breakage, Spoilage, Raw waste, Sale, Expected Qty, Δ Stock Qty, Closing and Stocktaking Value. The Total row sums up the period.
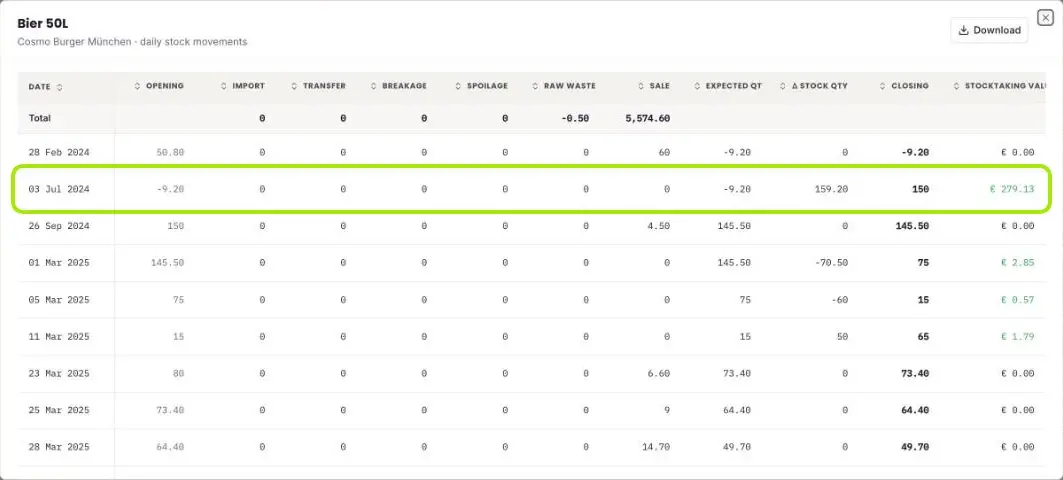
How to read the table:
- Expected Qty = opening stock plus import, plus or minus transfer, minus breakage, spoilage, raw waste and sale.
- On a stocktaking day, Δ Stock Qty shows the difference between the counted and the expected quantity. Closing is then the counted quantity.
- A negative stock means more was booked out than in. Often a goods receipt or a transfer is missing.
You can export this table with Download as well.
Unmapped POS sales
For POS items without a recipe, FoodNotify cannot calculate a theoretical cost – but the goods you sold are still missing from your stock. In the POS Turnover Mapped tile, click the icon at the top right. The list Unmapped POS Sales shows these items with quantity and revenue.
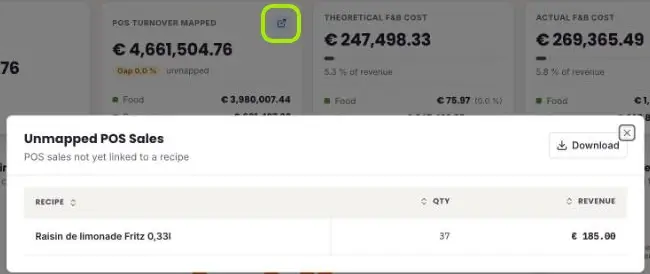
Connect these items to recipes: How do I connect POS articles to my recipes?
Runner vs. Bummer
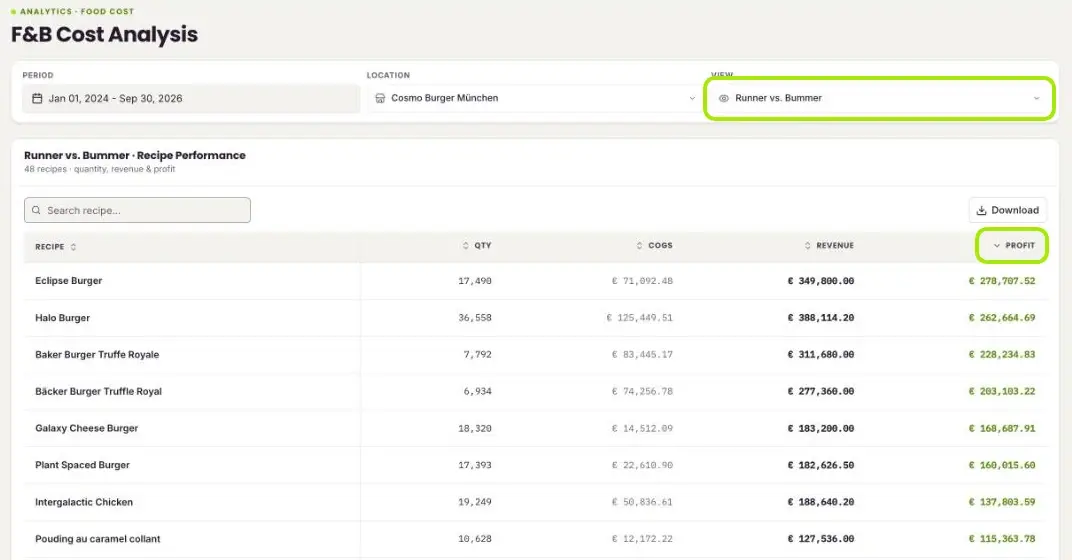
In the Runner vs. Bummer view you see for each recipe the quantity sold (Qty), the cost of goods sold (COGS), the Revenue and the Profit (revenue minus COGS). Sort by profit or quantity to find your best sellers (runners) and slow sellers (bummers). You can search and download this table too.
Food waste
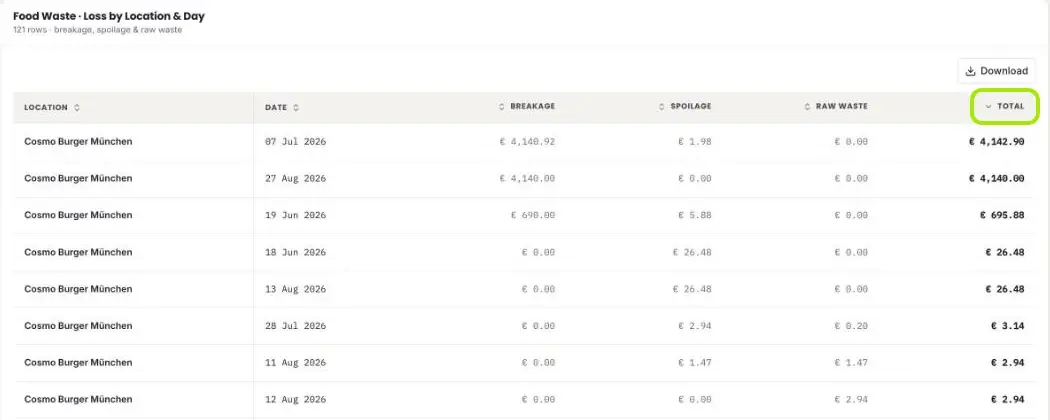
The Food Waste view lists your losses by location and day – split into Breakage, Spoilage and Raw waste, with the sum in Total. Sort by Total to find the most expensive days. Here is how to record waste: Recording food waste: less waste, more profit
Interpreting variances correctly
A large variance does not always mean goods were lost. Often a booking is missing. So check first:
- Are all POS items connected to recipes? (POS Turnover Mapped tile)
- Do your recipes have the right quantities, units and prices?
- Is every goods receipt booked – including goods that arrived without an order?
- Are transfers between locations booked?
- Is food waste recorded?
- Was the stocktaking counted in the right units?
The full checklist is here: How do I get accurate numbers in FoodNotify?