![Nav Support Center.svg]](https://help.foodnotify.com/hubfs/Support%20Center/Design/Nav%20Support%20Center.svg)
Cost of goods is the share of the sales price that the ingredients cost: recipe costs ÷ sales price. The contribution margin is what remains of the sales price after the ingredient costs. FoodNotify calculates both automatically from your suppliers' prices – provided all ingredients have a price.
In the recipe: the contribution margin calculator
- Open the recipe in edit mode.
- Under Sales price, click the arrow on the right of the price line.
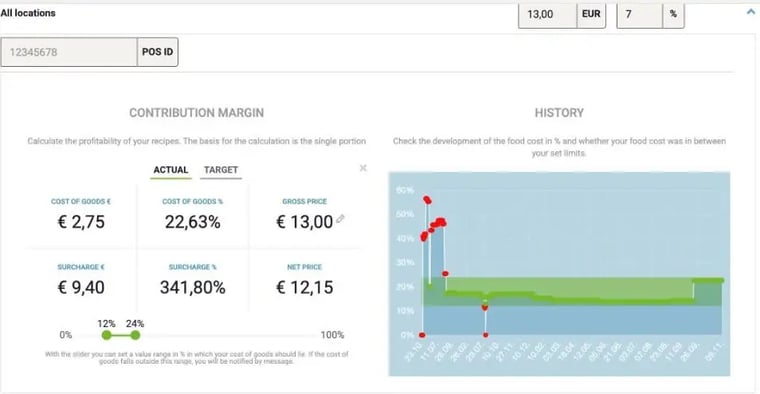
The Actual tab shows the values of your recipe:
- Cost of goods € and Cost of goods %: what the ingredients cost, in euros and as a percentage of the net price
- Surcharge € and Surcharge %: net price minus cost of goods, in euros and as a percentage of the cost of goods
- Net price and Gross price: your sales price without and with tax
In the Target tab, you set target values. If you change the gross price in the Actual tab, FoodNotify also adjusts the recipe's sales price.
With the slider, you set the range in which your cost of goods should lie. If it falls outside this range, you are notified. The History chart shows how your cost of goods has developed: the green band is your target range, red dots lie outside it.
Across all recipes: the Contribution margin overview
Under Recipes › Contribution margin, you see all recipes at all locations at a glance. The same recipe can have a different cost of goods at each location, for example because of different items or prices.
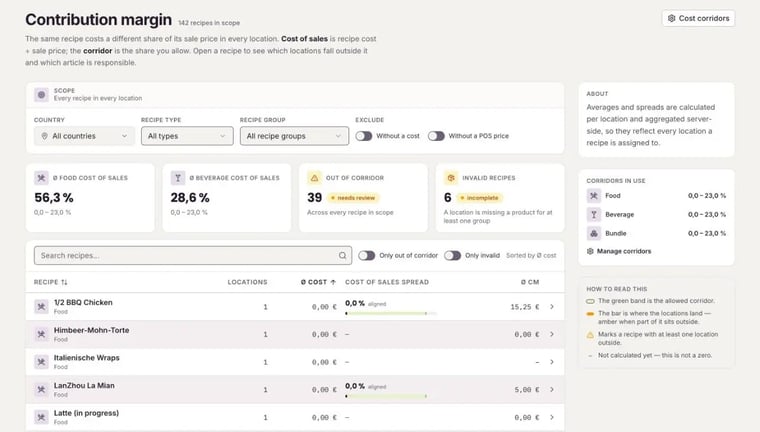
- At the top, you filter by Country, Recipe type and Recipe group and exclude recipes Without a cost or Without a POS price.
- The tiles show the average cost of sales for food and beverages, how many recipes are Out of corridor and how many are Invalid recipes because an item is missing for a commodity group at one location.
- The table shows for each recipe the locations, the Ø cost, the Cost of sales spread and the Ø CM. With Only out of corridor and Only invalid, you narrow down the list.
The How to read this panel on the right explains the display: the green band is the permitted corridor, the bar shows where the locations lie – yellow if part of it is outside. A dash means "not calculated yet", not zero.
View a recipe by location
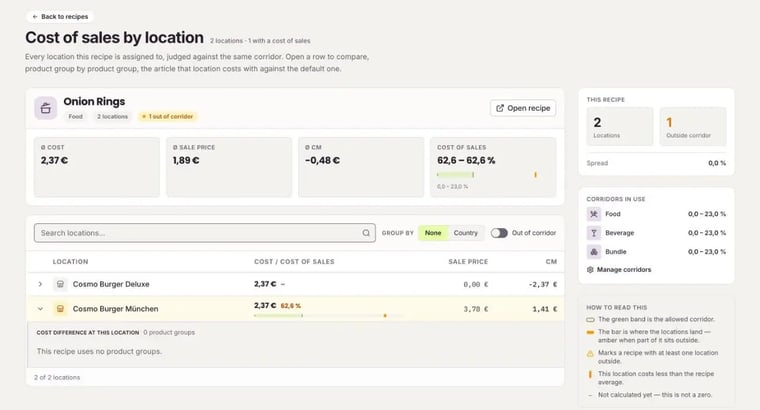
Click a row to see the Cost of sales by location: Ø cost, Ø sales price, Ø CM and the cost of sales per location. Expand a location to compare that location's item with the default item, commodity group by commodity group. Open recipe takes you straight to the recipe.
Set cost corridors
A corridor is the share of the sales price that a recipe may cost. In the overview, click Cost corridors:
- Under Corridor per recipe type, set a range for Food, Beverage and Bundle, for example 0–23%, and click Save.
- Under Corridor per recipe group, you narrow the corridor for individual groups: tick the groups, enter the values and click Apply. With Reset to type default, the recipe type's corridor applies again.
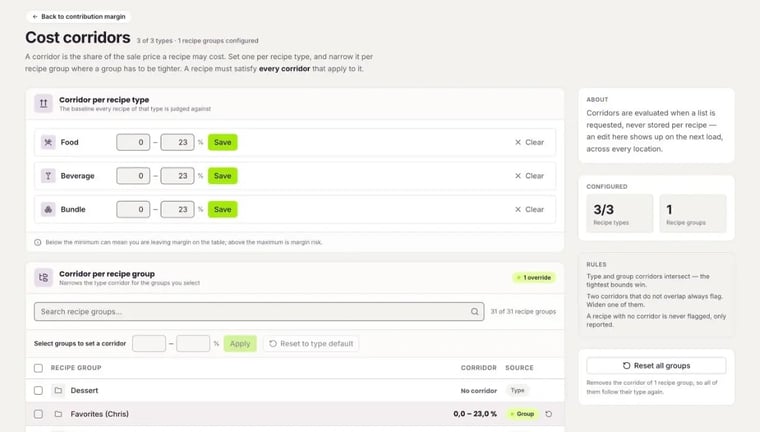
If several corridors apply to a recipe, the narrowest limits count. Below the minimum you may be giving away margin; above the maximum there is a margin risk. A recipe without a corridor is never flagged.
To edit corridors, you need the permission Edit recipes corridors: How do I create roles for users?
The recipe dashboard shows you how your recipes perform in sales.