![Nav Support Center.svg]](https://help.foodnotify.com/hubfs/Support%20Center/Design/Nav%20Support%20Center.svg)
The recipe dashboard shows you how your recipes perform financially. Open Recipes › Dashboard.
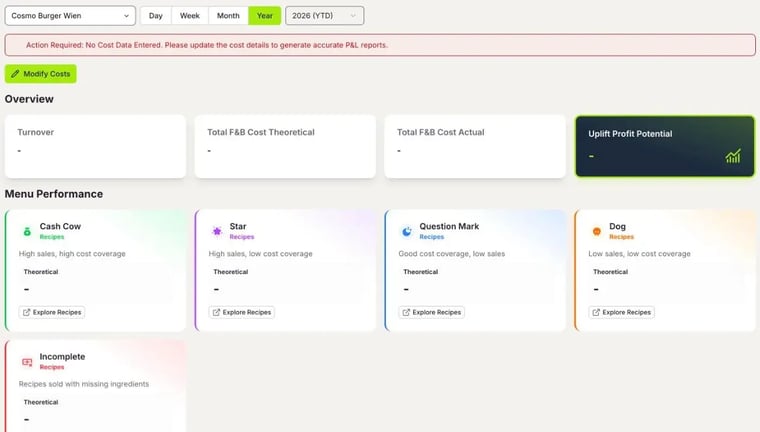
Choose location and period
At the top left, choose the location and the period: Day, Week, Month or Year.
Overview
- Turnover: what you turned over with your recipes in the period
- Total F&B Cost Theoretical: what the recipes sold cost according to their recipe
- Total F&B Cost Actual: your actual costs according to the cost data you enter
- Uplift Profit Potential: where you can earn more with your recipes
The values are based on your sales data, for example from your POS connection. Without sales data, the fields stay empty.
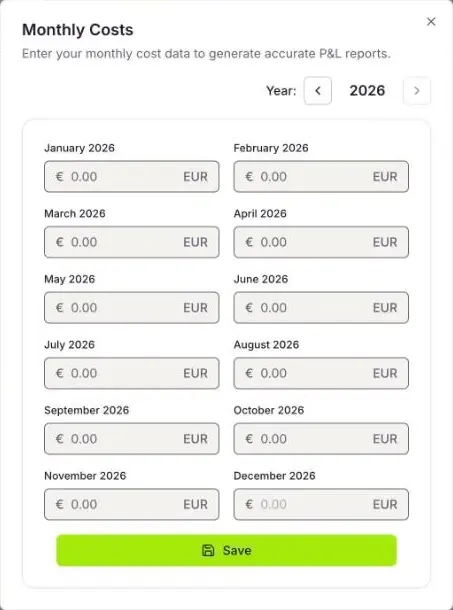
Enter costs
So that FoodNotify knows your actual costs, click Modify Costs. In the Monthly Costs window, enter your costs for each month and click Save. As long as there is no cost data, you see the Action Required notice at the top.
Menu Performance
FoodNotify divides your recipes into four groups according to sales and cost coverage:
- Cash Cow: high sales, high cost coverage – your top performers
- Star: high sales, low cost coverage – popular, but worth a look at the calculation
- Question Mark: good cost coverage, low sales – profitable, but ordered too rarely
- Dog: low sales, low cost coverage – candidates for taking off the menu
There is also Incomplete: recipes sold with missing ingredients. Explore Recipes shows you which recipes are in a group.
How to check the calculation of individual recipes: How do I keep track of contribution margin and cost of goods?